Biostatistics to accelerate research

Precision biostatistics,
in a seamless no-code interface

A statistical analysis suite for researchers: from study planning to a publication-ready analysis, with every figure and table generated for you.

Zero data retention

Your dataset is processed only for your active session and permanently discarded when the session ends. It is never written to a database and never retained.

100% AI-free

Every result comes from deterministic, rule-based statistical engines. Your data is never sent to a third-party AI service. MaiStat aims to make every insight verifiable and traceable back to your original study parameters.

How it's organised

The workflow mirrors the scientific method.

Plan

Design the study

Study-design routing, effect-measure selection, and sample-size calculation.

Prepare

Curate the data

Import data, assess missingness, and balance observational cohorts.

Analyse

Run the analysis

Descriptive, comparative, diagnostic, survival, longitudinal, and prediction.

Synthesise

Pool the evidence

Meta-analysis, network meta-analysis, and certainty-of-evidence assessment.

What you get

From study planning to publication-grade analytics.

27

Sample-size calculators

From two means to cluster RCTs, non-inferiority, equivalence, diagnostic accuracy and more.

20+

Reviewer checks

Reviewer-grade methodological flags mapped to CONSORT, STROBE, PRISMA, STARD and TRIPOD.

Publication-ready tables

Baseline characteristics tables, results tables and Summary-of-Findings, exported to Word & PDF.

{ }

R & Python reproducibility code

Every analysis ships with runnable code so a researcher can reproduce the result independently.

Figures

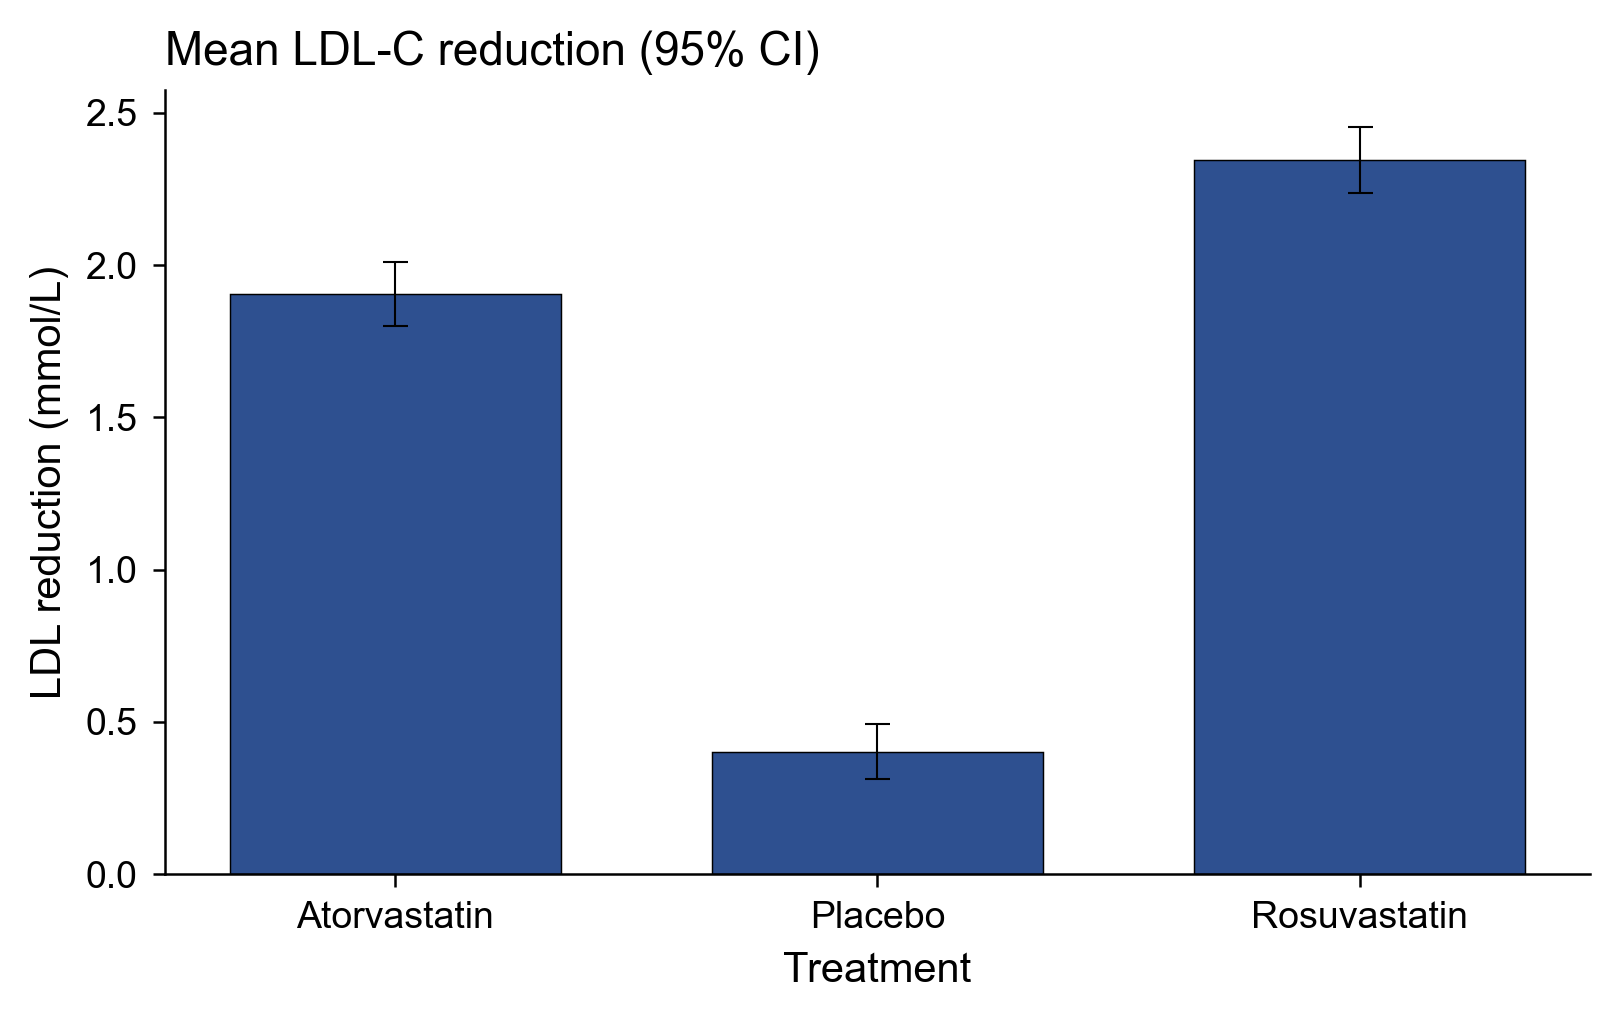
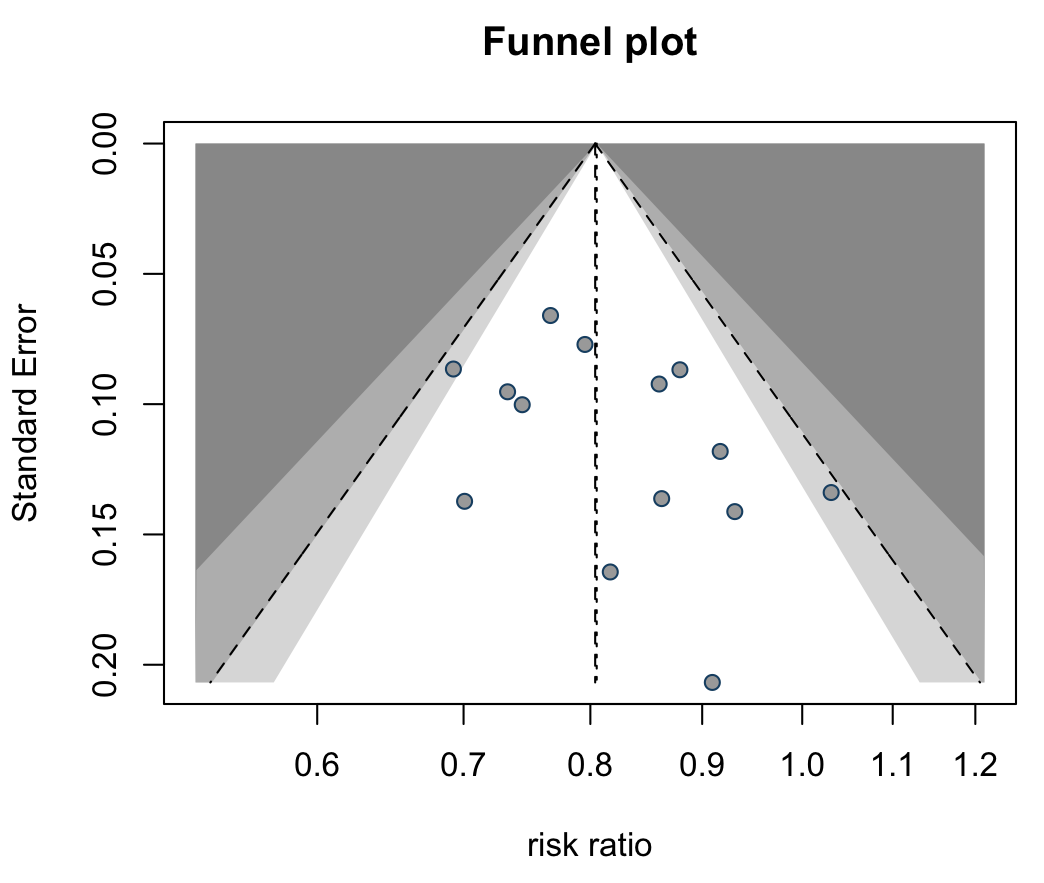
Publication-ready figures, generated for you.

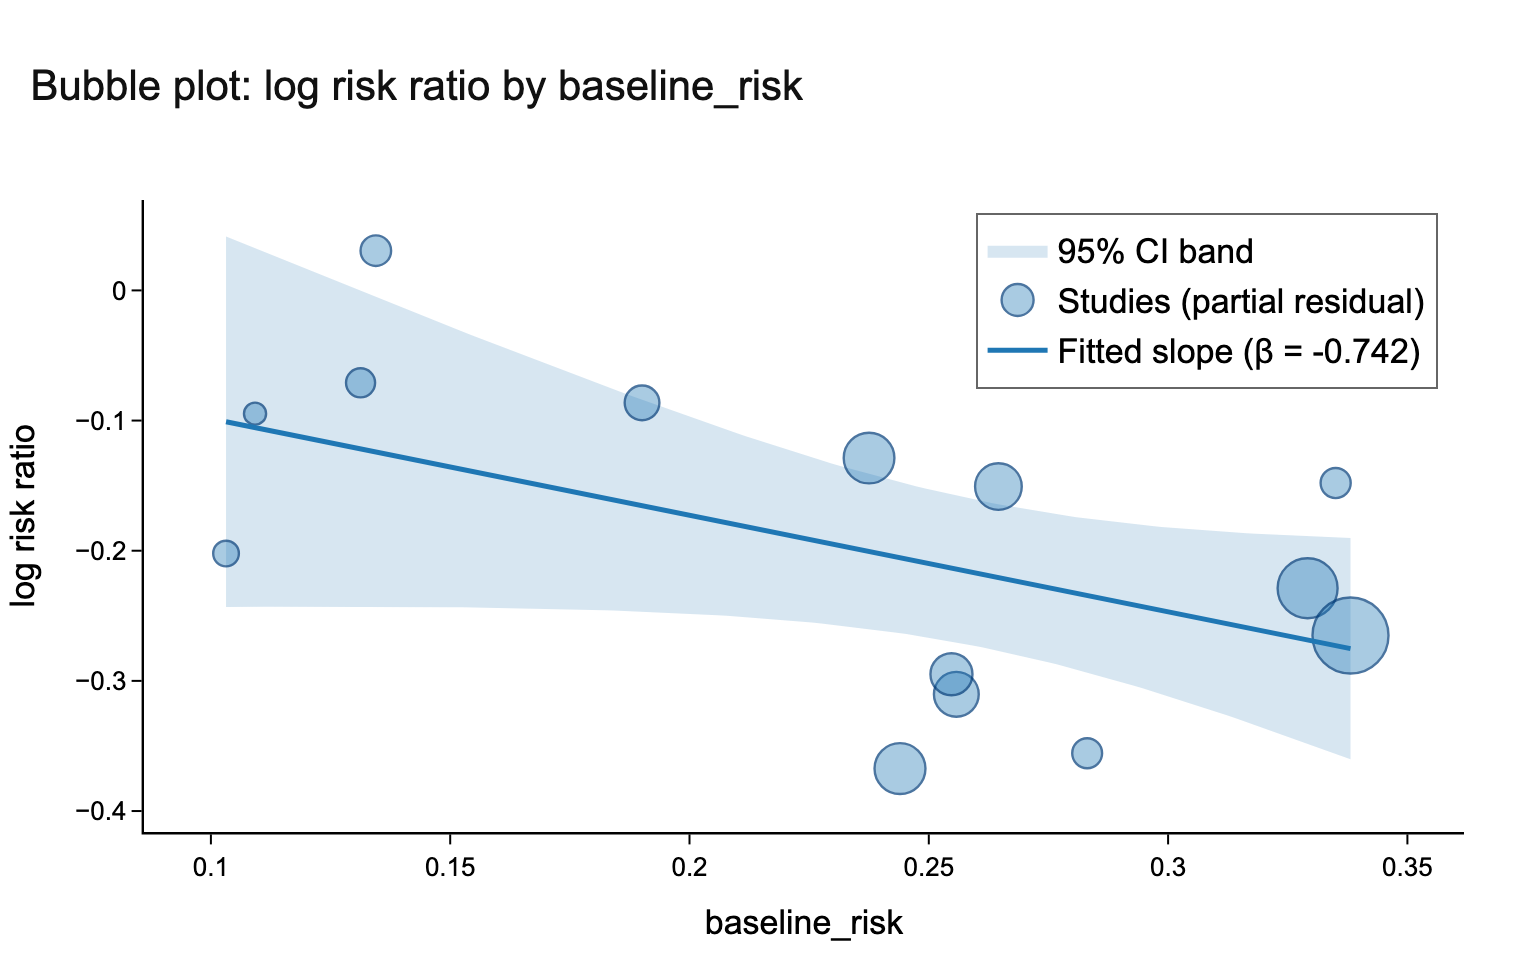
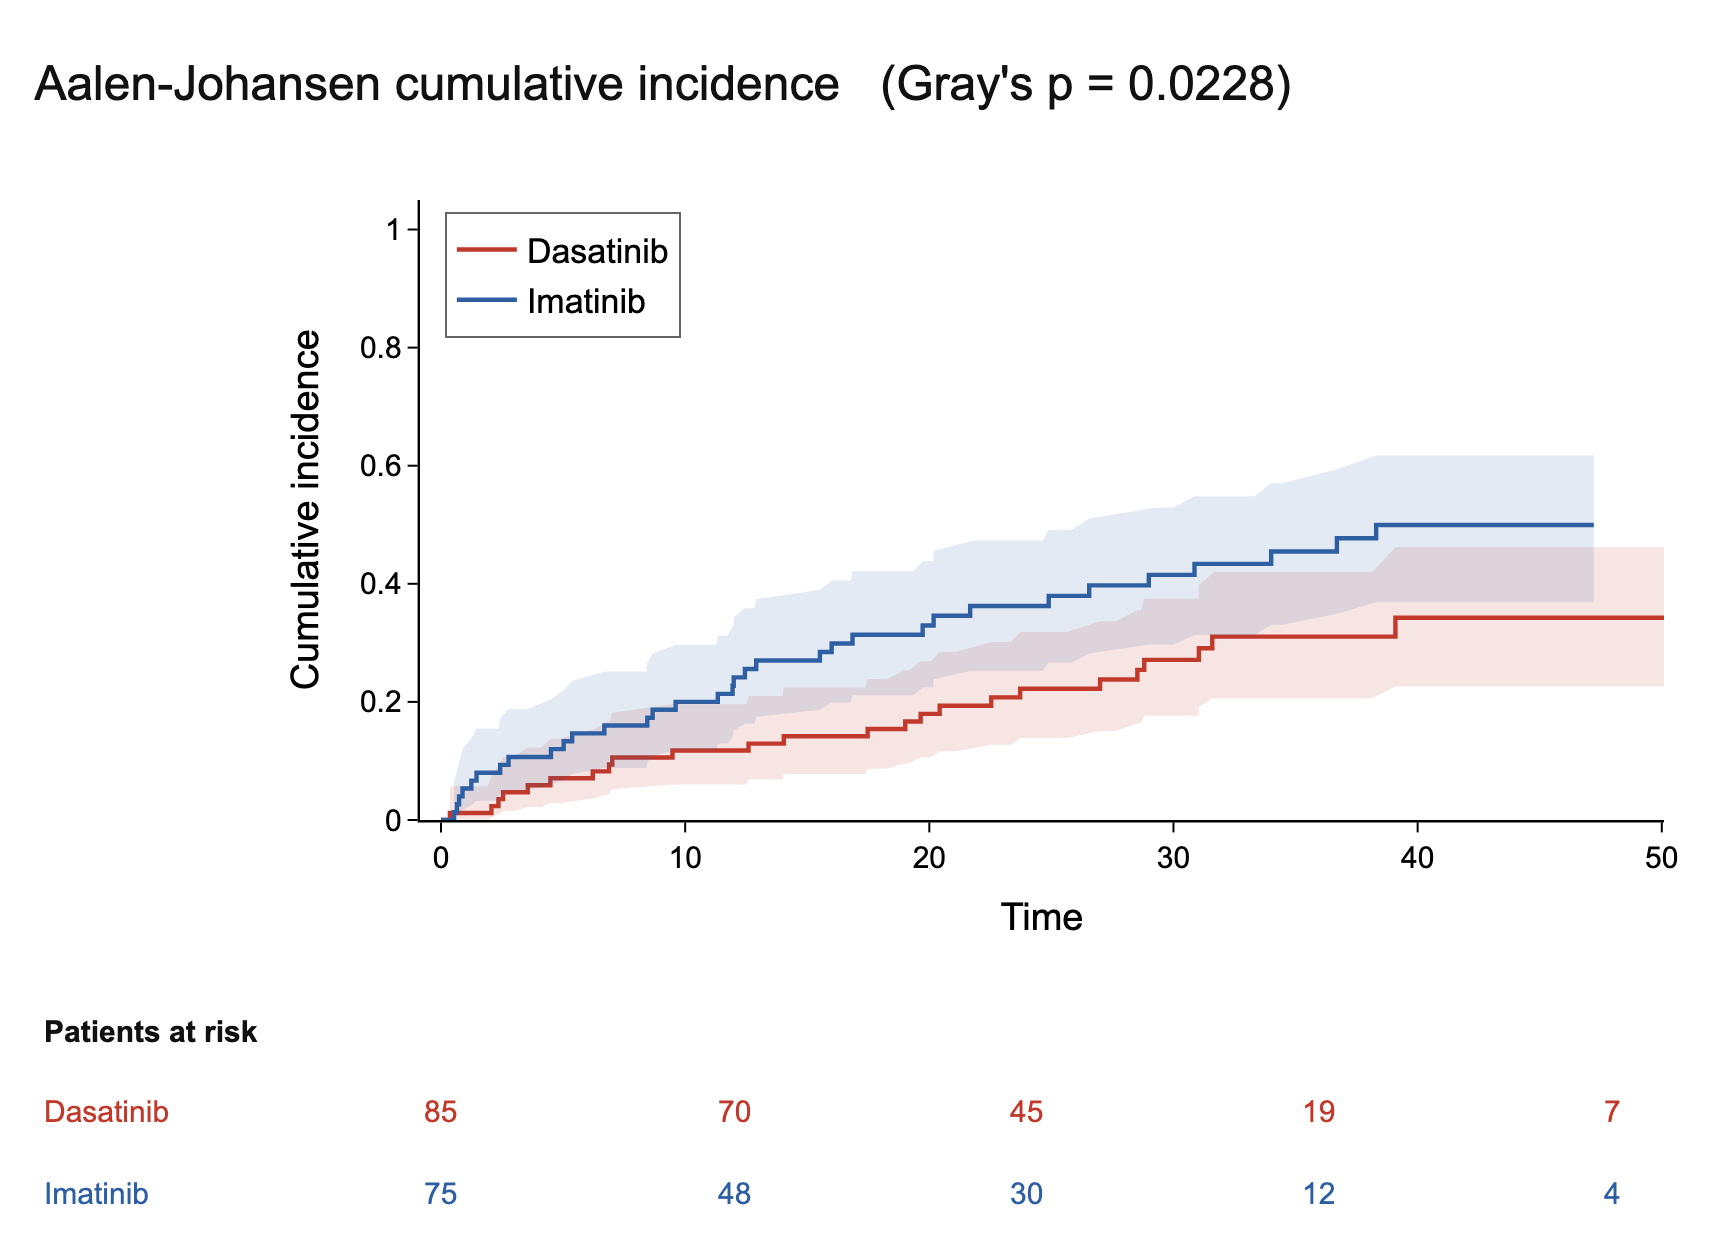
Every figure below was produced by MaiStat from its built-in synthetic datasets, the same output you get on your own data.

Comparative

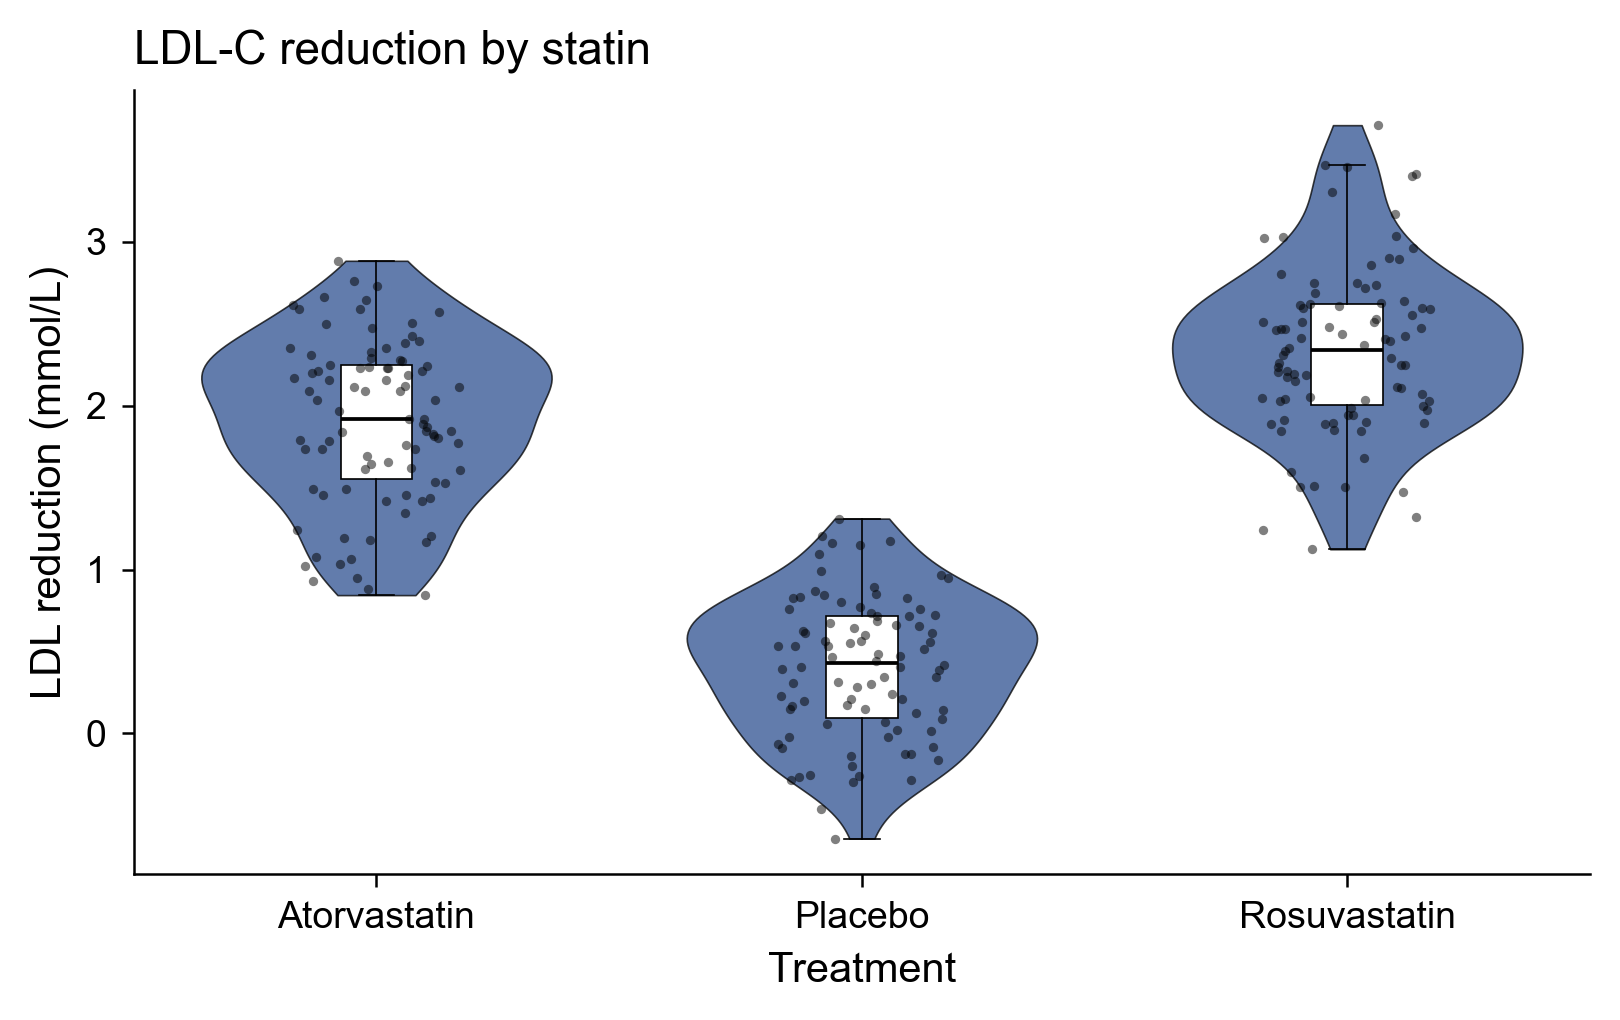
Box-and-whisker plots

Group comparisons with medians, quartiles and outliers, alongside the assumption checks and the exact test MaiStat routes you to.
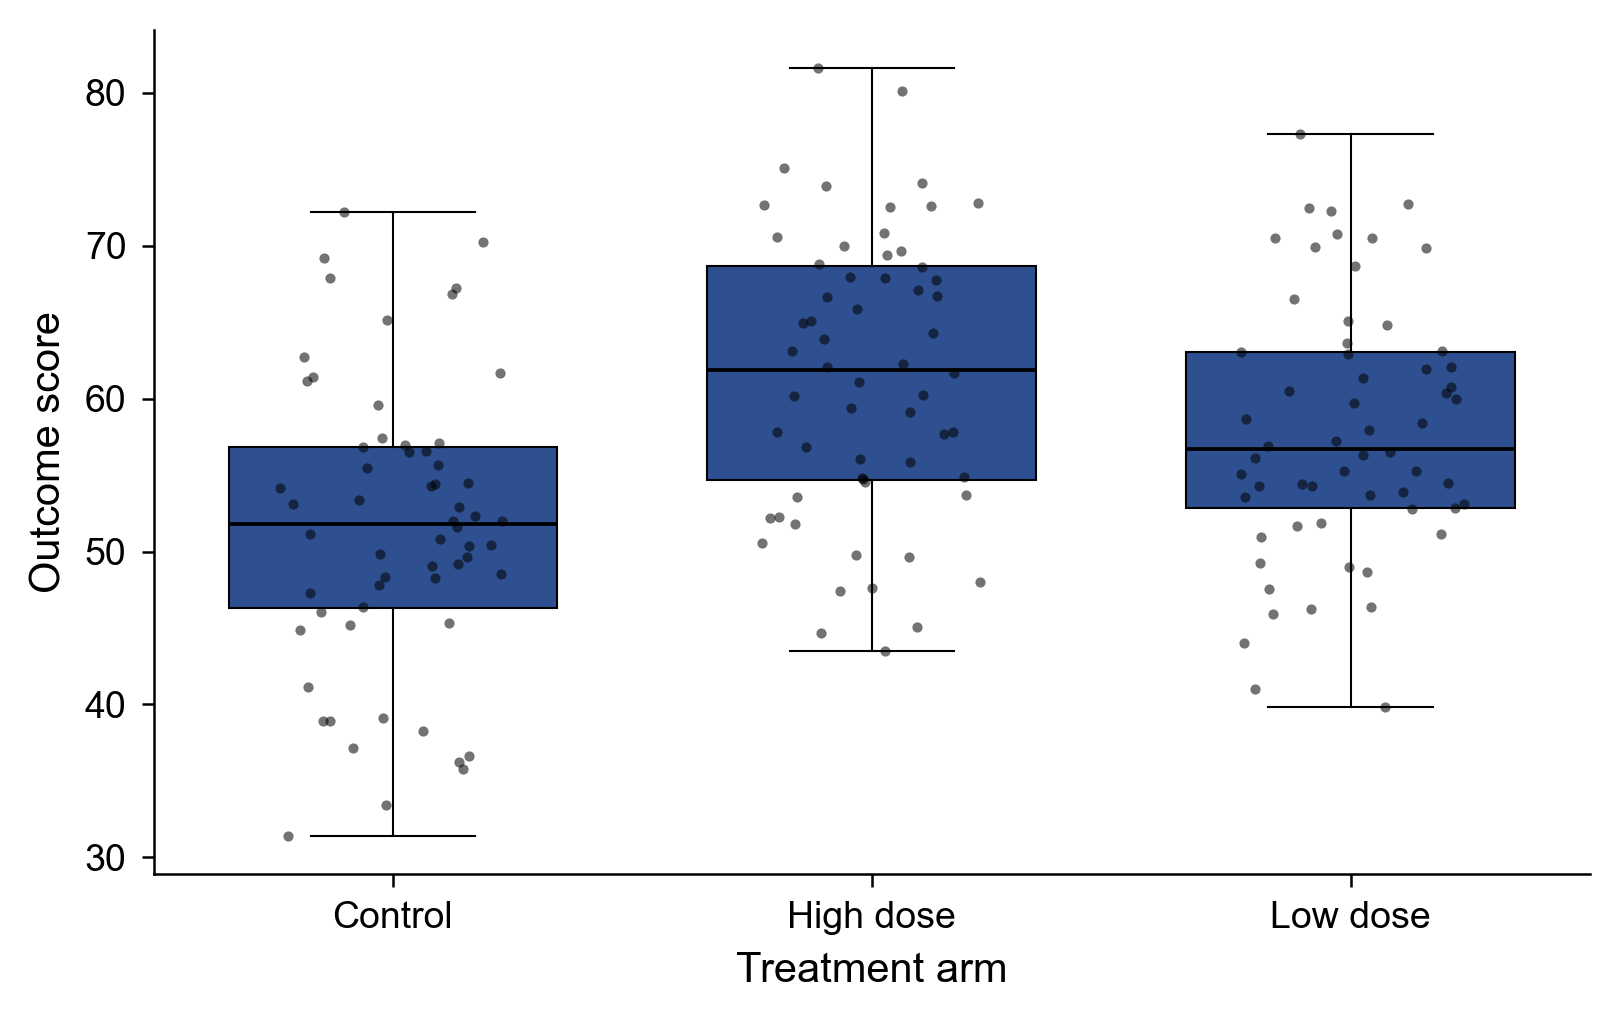
Box-and-whisker plot generated by MaiStat
Synthesise

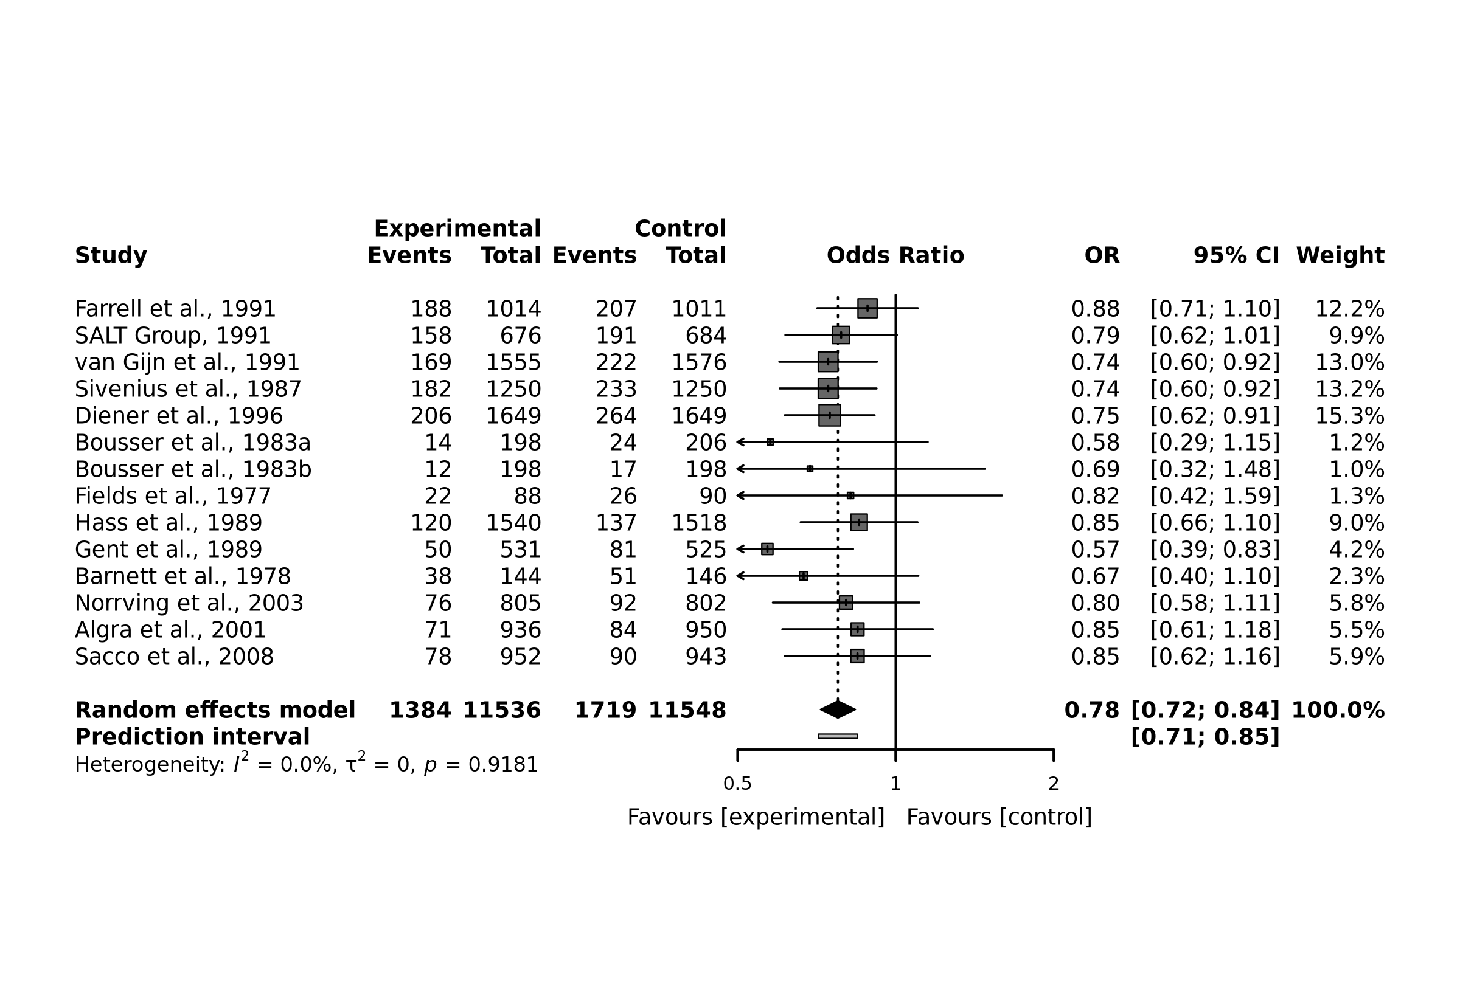
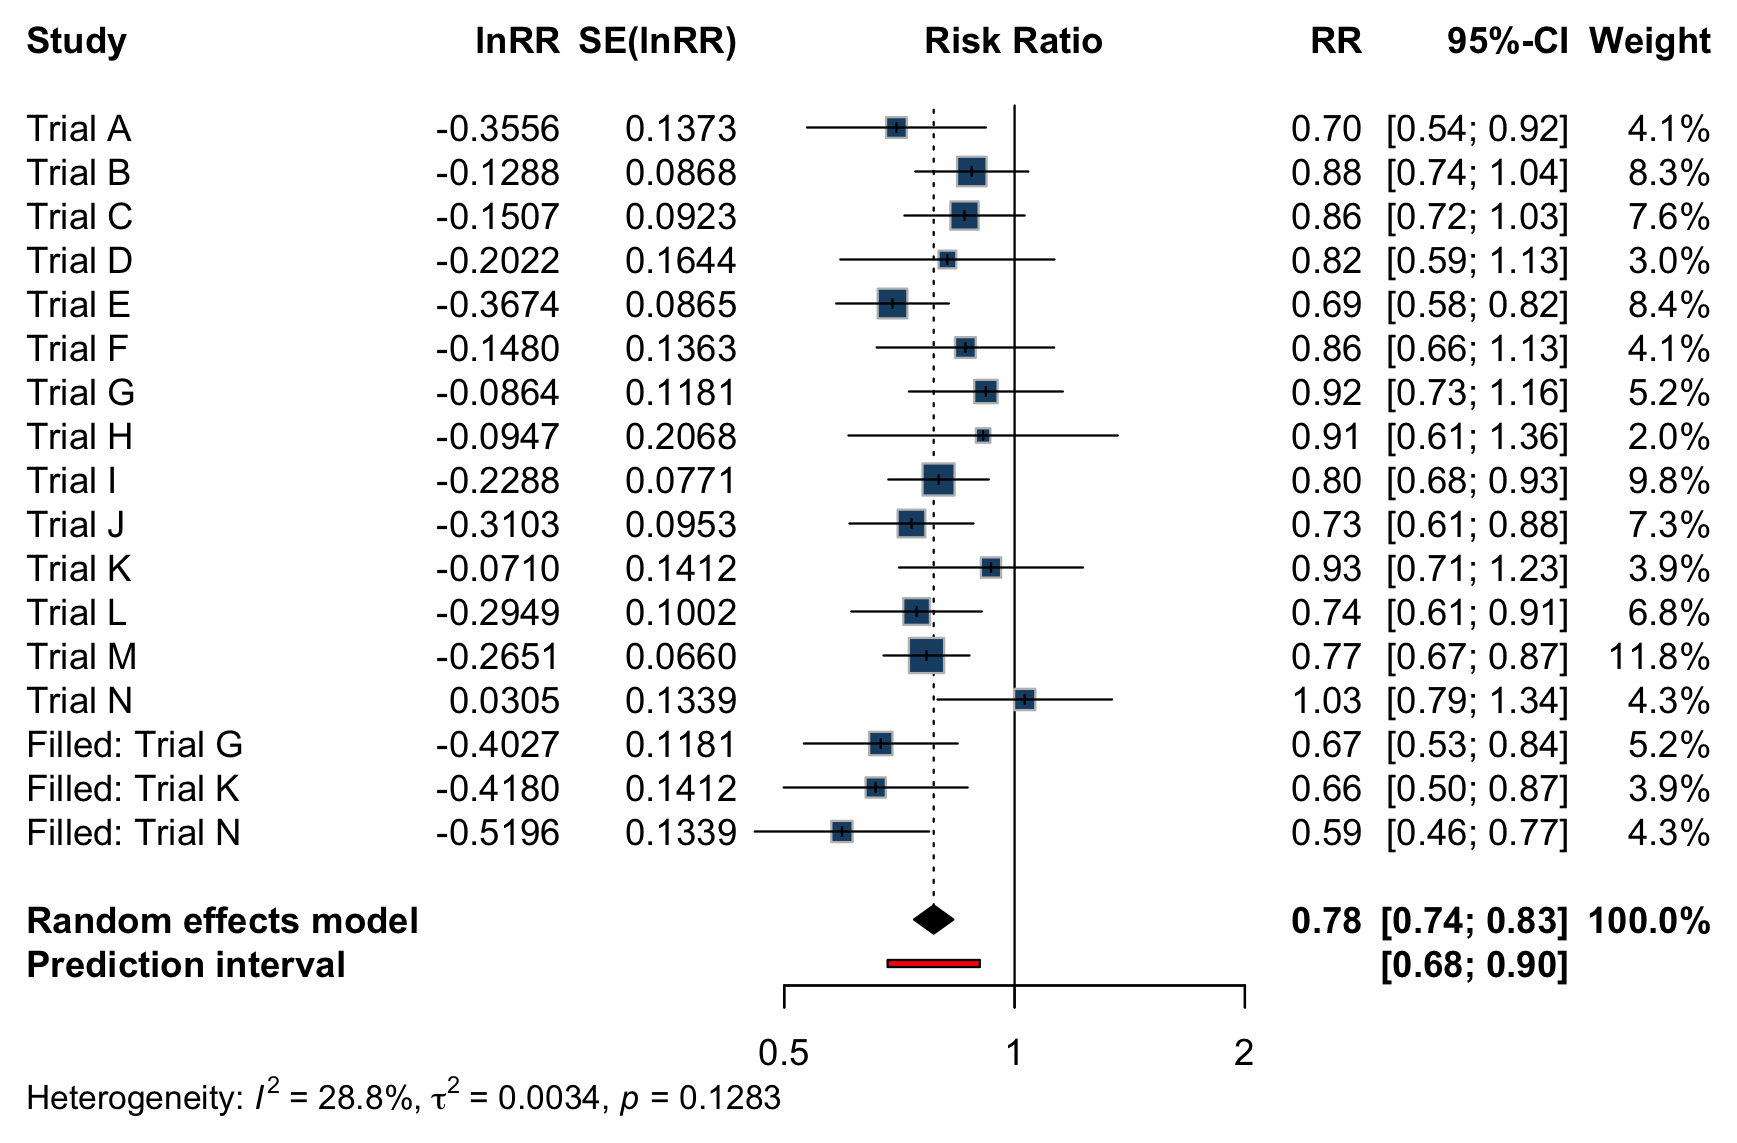
Forest plot (meta-analysis)

Pooled effects with per-study weights, heterogeneity (I², τ²) and a prediction interval.

Meta-analysis forest plot generated by MaiStat
Survival

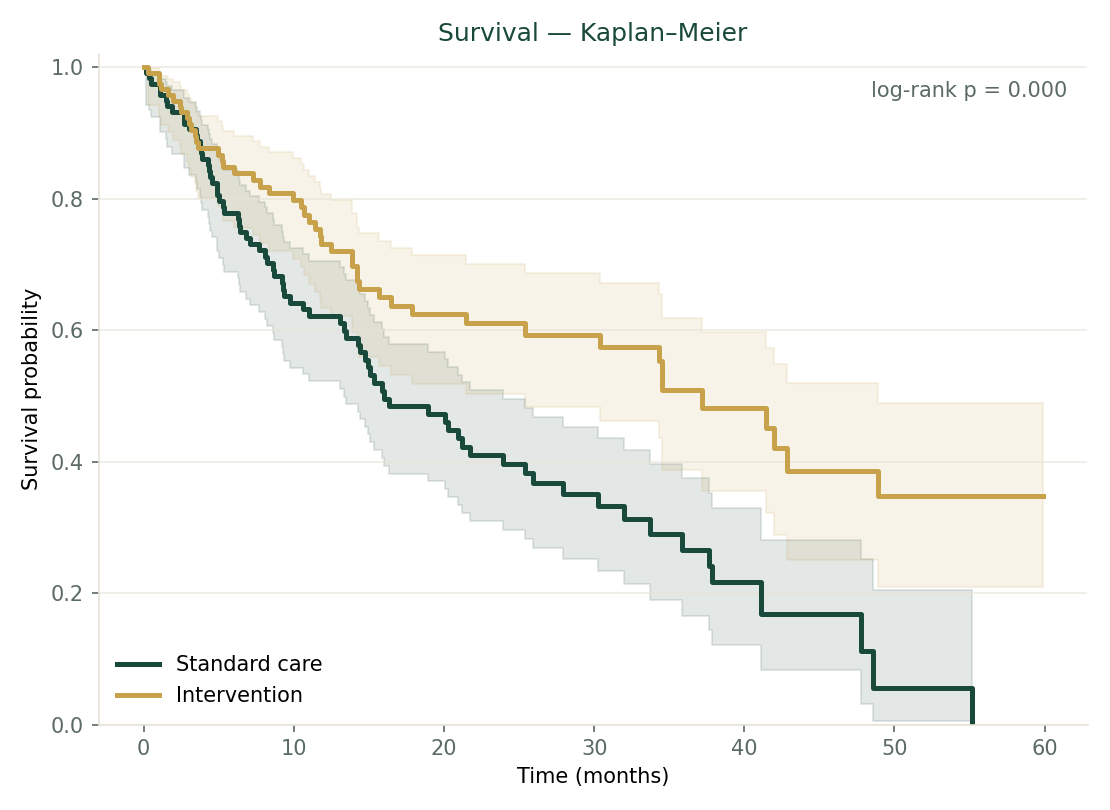
Kaplan–Meier curves

Time-to-event survival with at-risk tables and the log-rank comparison between groups.

Kaplan-Meier survival curve generated by MaiStat
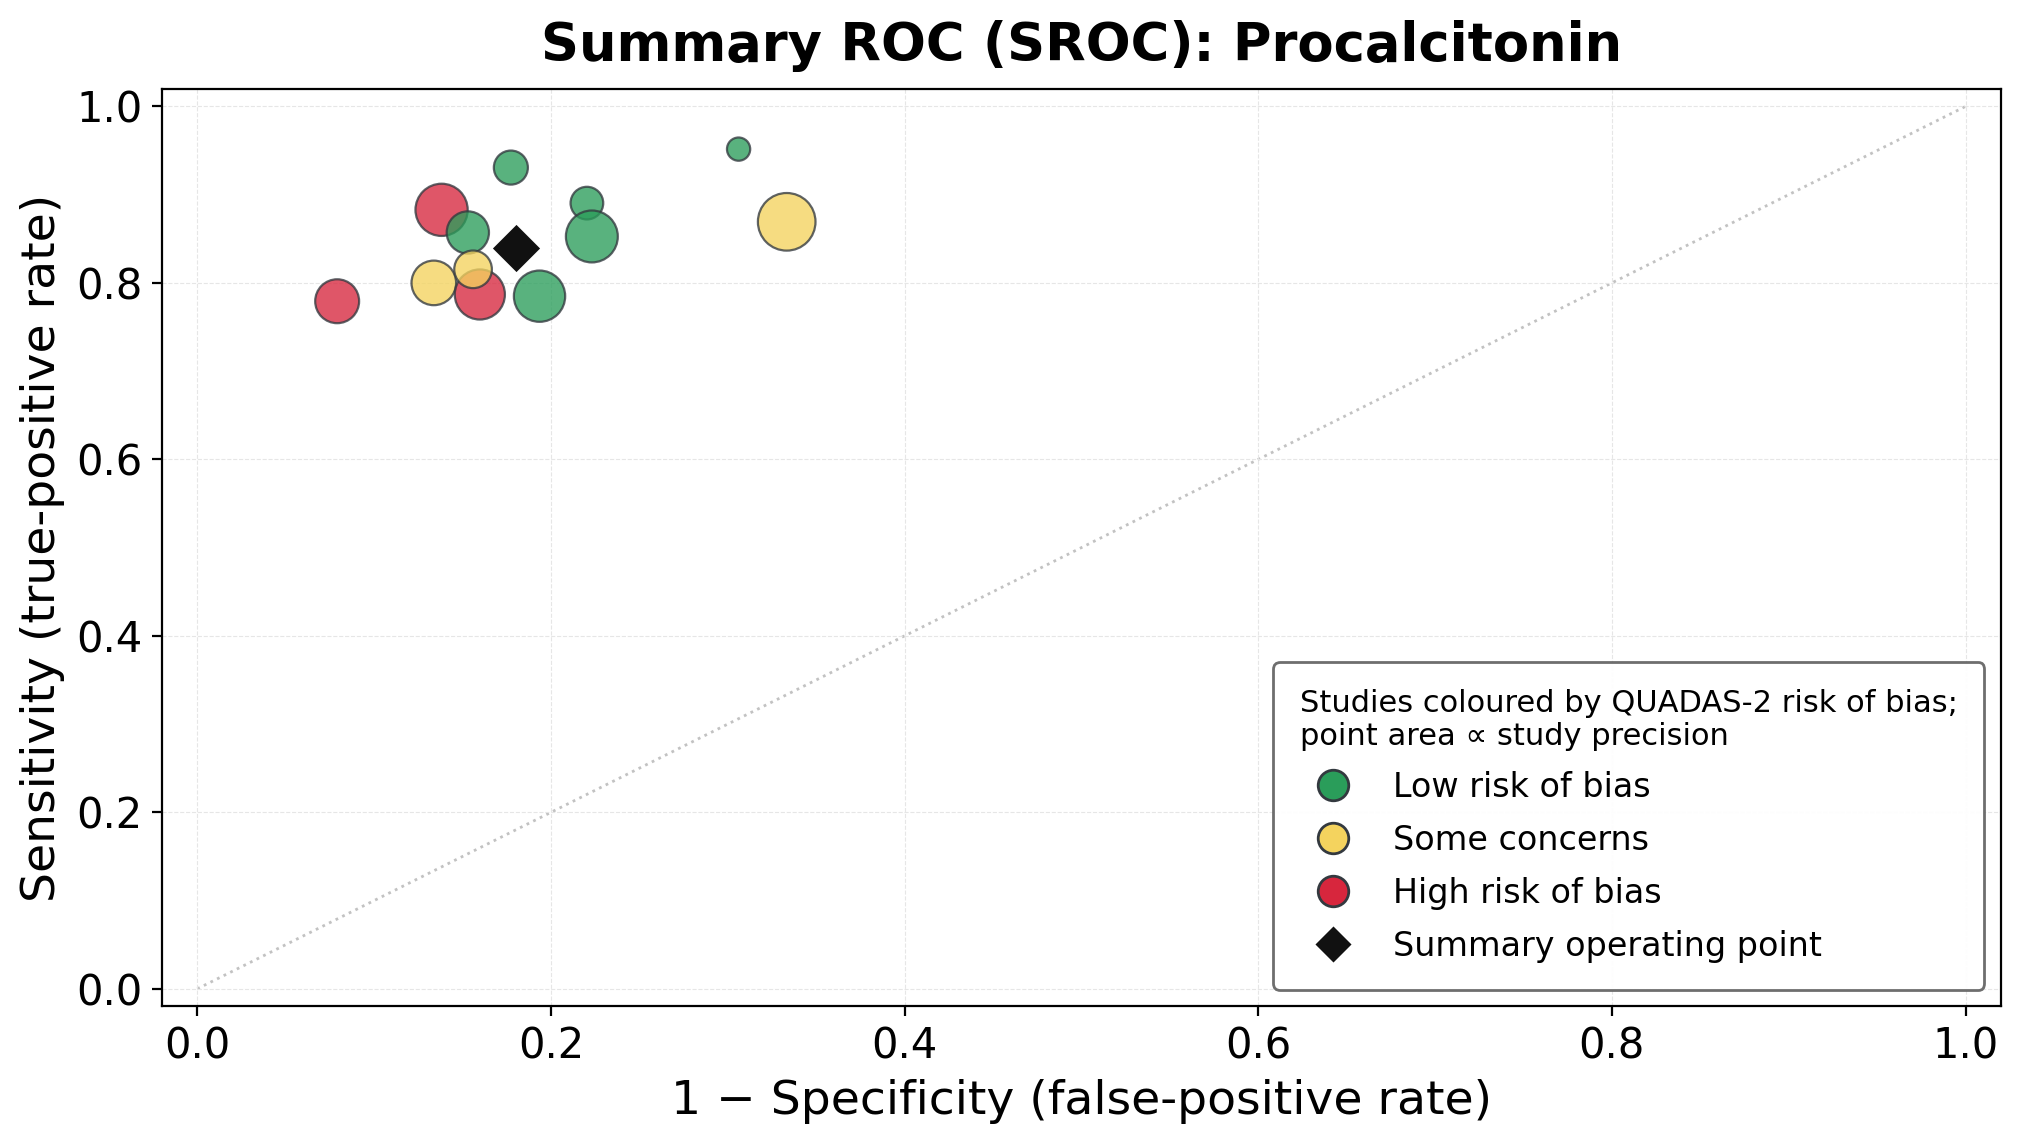
Diagnostic

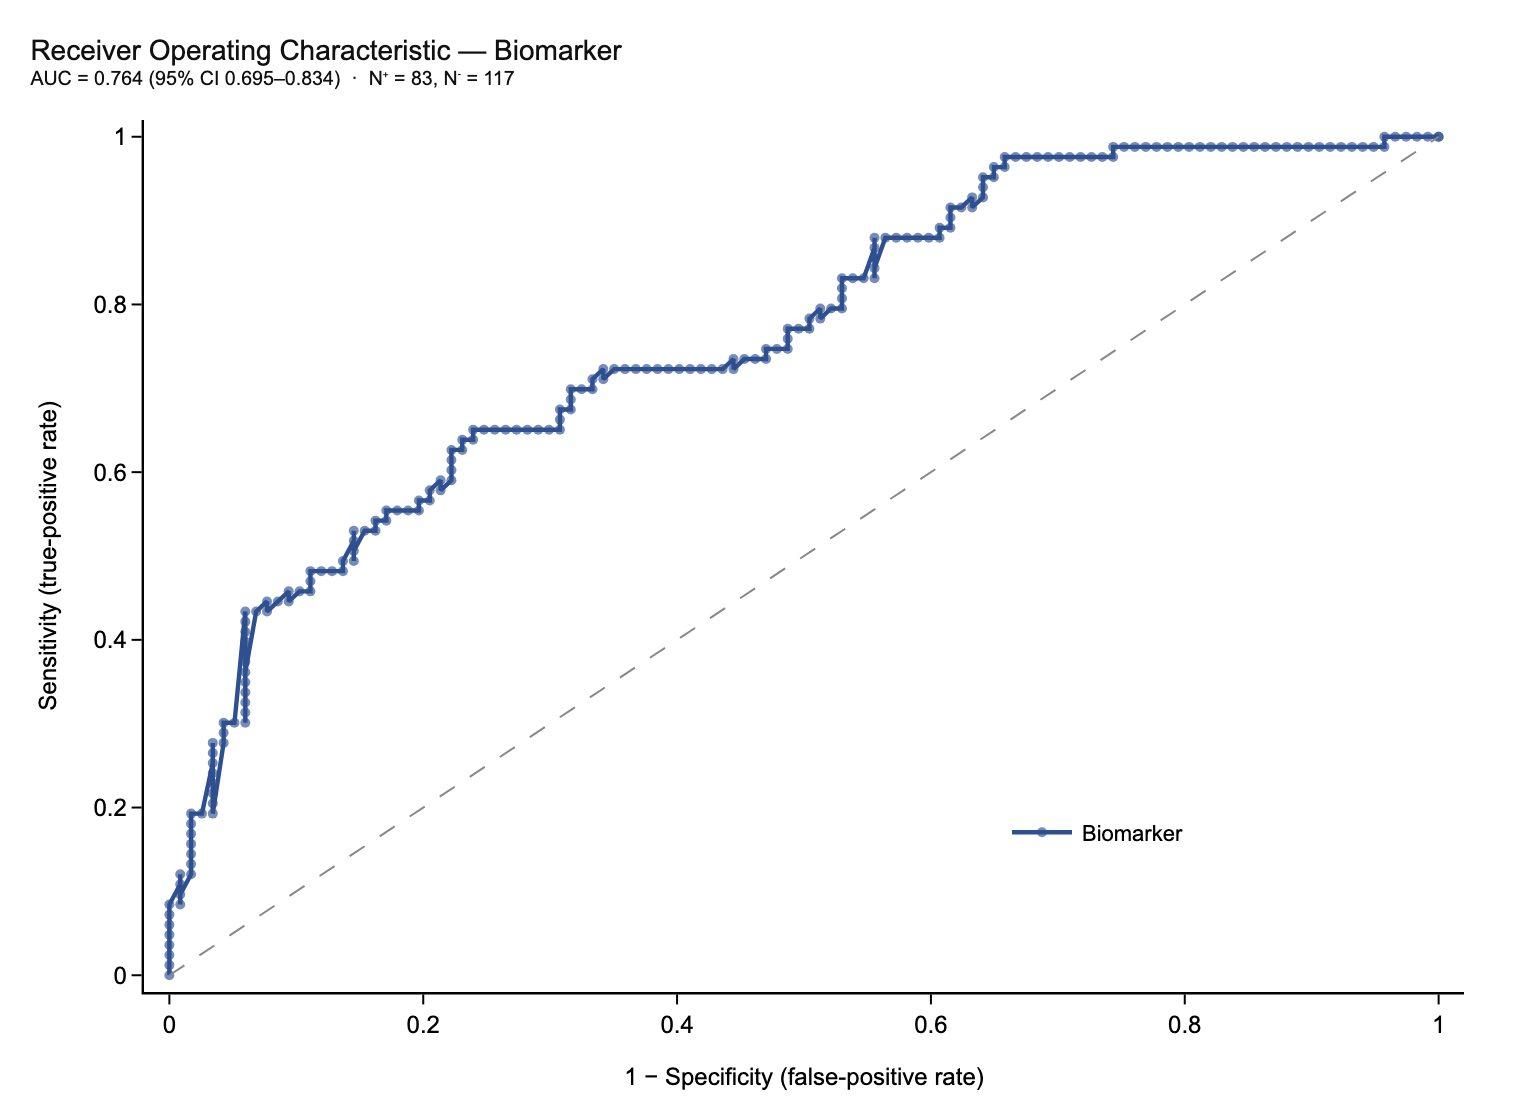
ROC curve & AUC

Diagnostic accuracy with the area under the curve and the optimal threshold.

ROC curve generated by MaiStat
Network meta-analysis

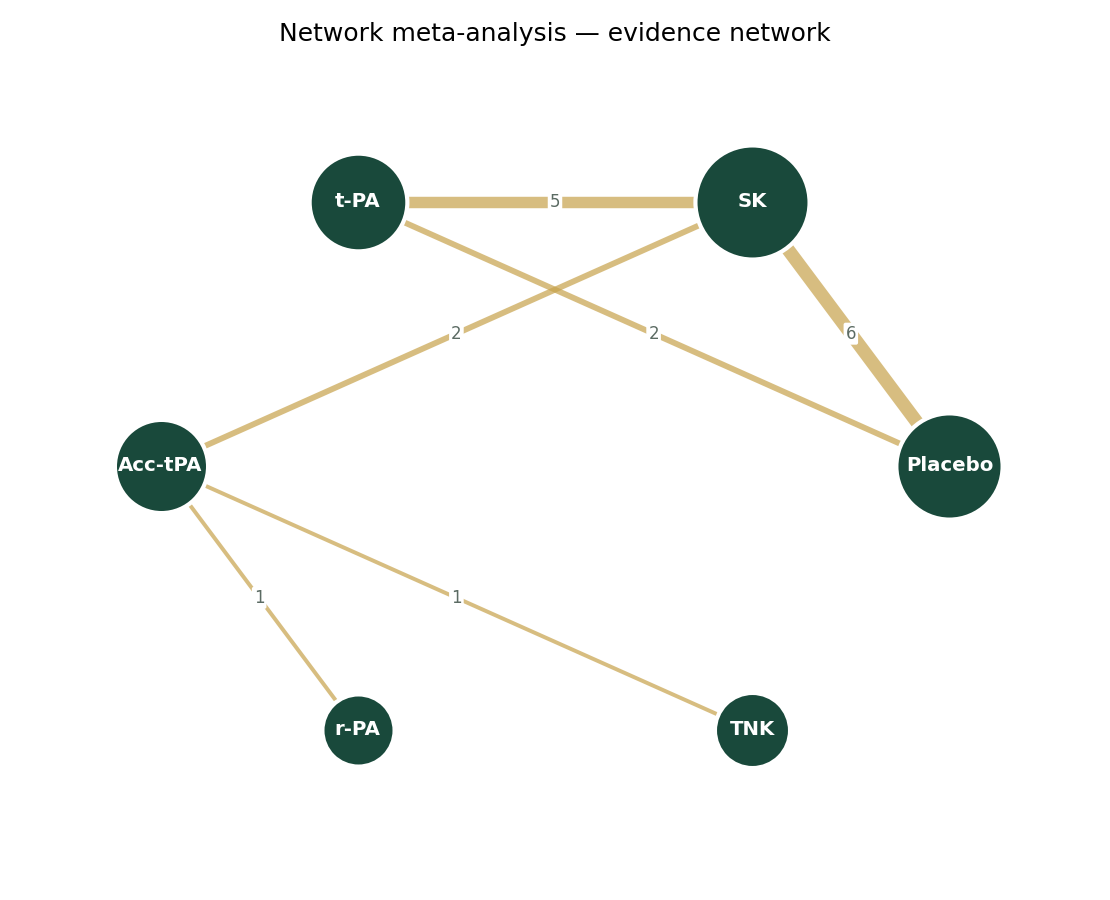
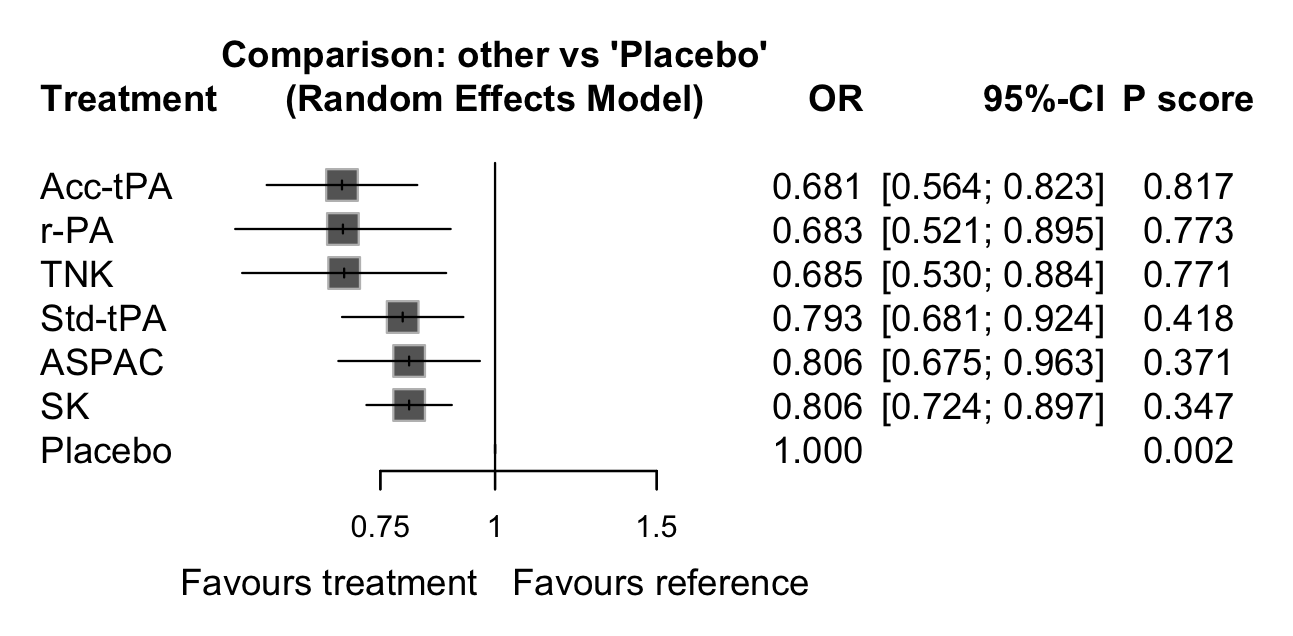
Network graph & league table

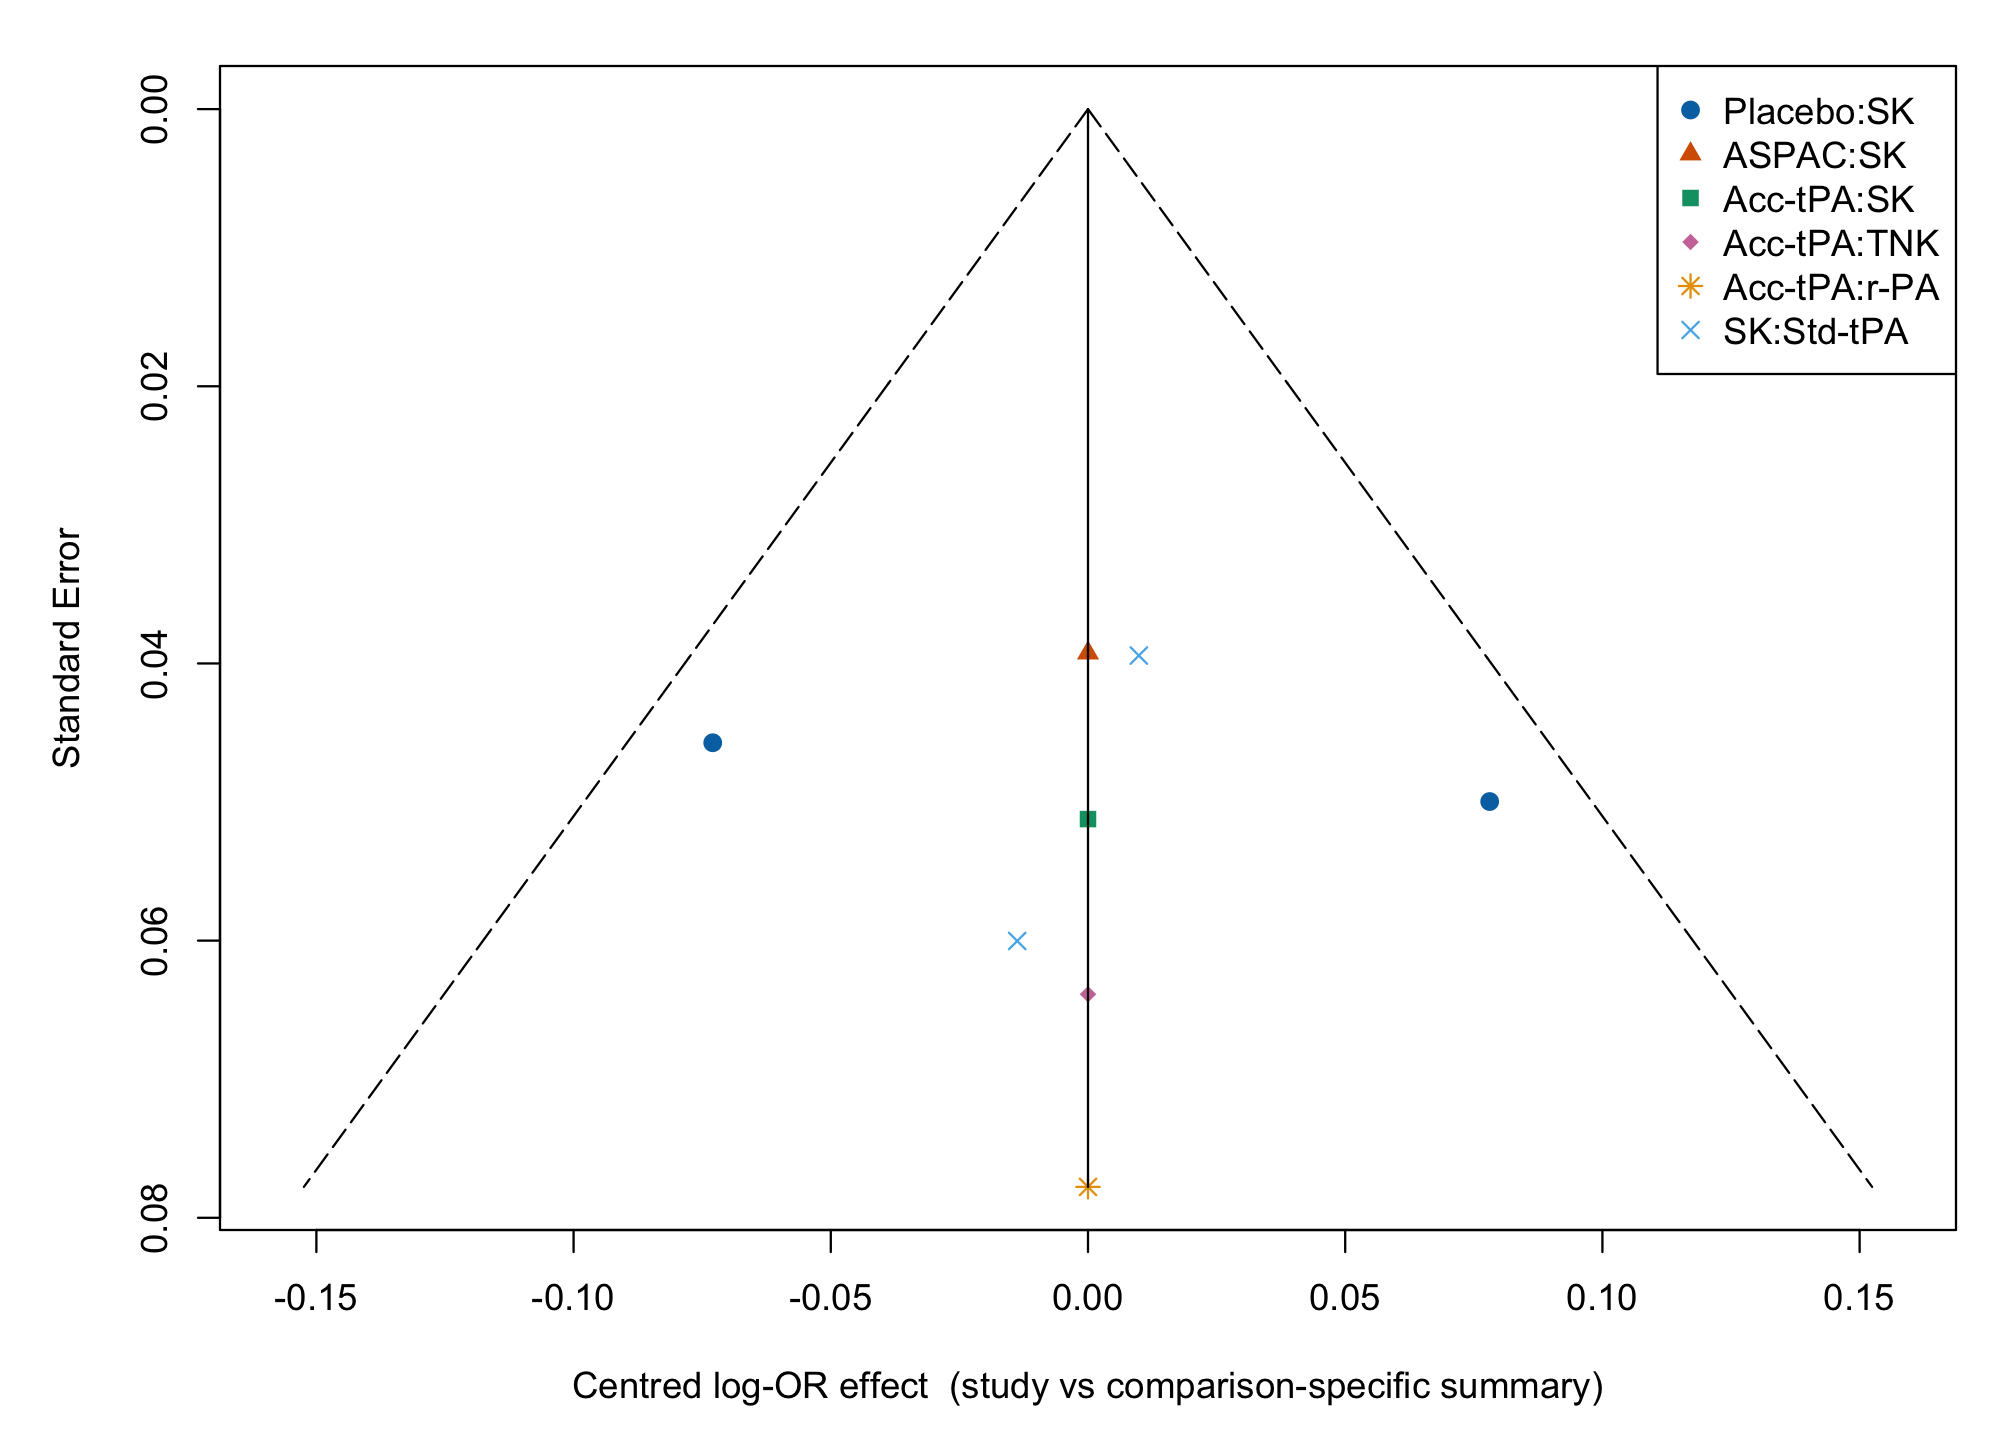
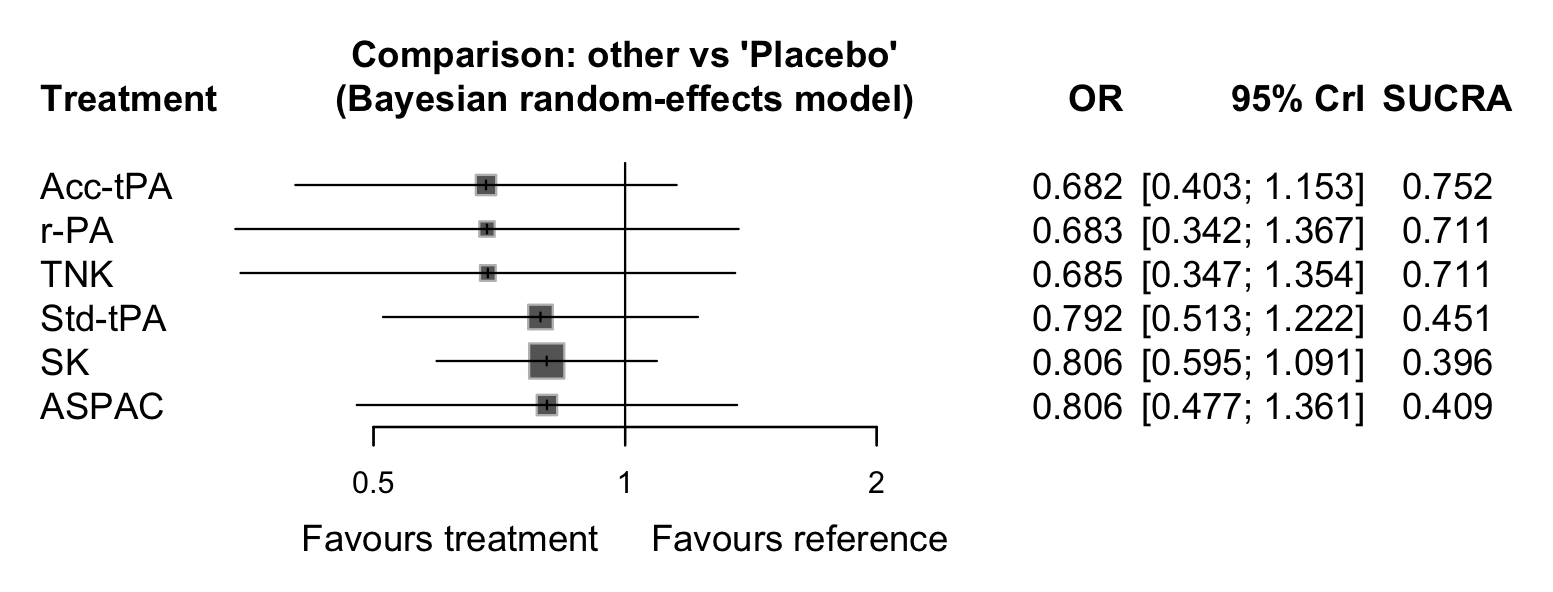
Multi-treatment comparisons with the evidence network, ranked effects and SUCRA.

Network meta-analysis graph generated by MaiStat

Deterministic • Private • No-code • Reproducible

Deterministic engines Zero data retention No-code interface R & Python reproducibility

Run analyses on the in-built synthetic datasets, free, after you sign in. Explore every module before you bring your own data.

How to cite

Banerjee M. MaiStat: a browser-based deterministic statistical analysis suite for publication-grade research. 2026. Available at https://maistatresearch.com.

Questions, bugs, or feature requests

Send a note and it goes straight to the team.